Continue to Site

Welcome to our site!

Electro Tech is an online community (with over 170,000 members) who enjoy talking about and building electronic circuits, projects and gadgets. To participate you need to register. Registration is free. Click here to register now.

  • Welcome to our site! Electro Tech is an online community (with over 170,000 members) who enjoy talking about and building electronic circuits, projects and gadgets. To participate you need to register. Registration is free. Click here to register now.

plotting filter characteristics

Status
Not open for further replies.

Neil Groves

New Member
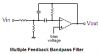
i have built some bandpass filters for my colour organ and they work well, however is there an easy way to plot the frequency curve on a piece of graph paper? it would be interesting to see how changing certain component values alters the frequency response.

Neil.
 
I use spice (LT spice) or graph paper.

Can you post a schematic of the filters and I will send you some log/log graph paper and instructions. (PDF format)
Passive or active filters?
 
Use LTSpice, or other free downloadable software, to simulate the circuit and plot its response.
 
The filter you used a couple of weeks ago is called a Multiple Feedback Bandpass Filter and it has a very narrow frequency range at its peak then a very wide frequency range further down from its peak. I recommended that you use a lowpass filter for low audio frequencies, a highpass filter for high audio frequencies and a combination of a Sallen and Key 2nd-order lowpass and highpass filters as a mid-frequencies bandpass filter.

If you use an extremely simple Multiple Feedback Bandpass Filter then you might complain that it either shows only one frequency or it shows almost all frequencies because it is extremely simple. The Multiple Feedback Bandpass Filter has a simple (very poor) frequency response like this (multiply its frequencies by 10):

The second-order Sallen and Key bandpass filter that I posted on your other thread (why so many threads for the same thing?) has a wide frequency range of all the mid frequencies and has sharp skirts at its peak that restrict its response only to the mid-frequencies. Its response is like this:
 

Attachments

  • multiple feedback bandpass filter response.PNG
    0 bytes · Views: 5
  • multiple feedback bandpass filter.PNG
    multiple feedback bandpass filter.PNG
    5.1 KB · Views: 159
  • Sallen and Key bandpass filter.PNG
    0 bytes · Views: 5
Audioguru....That answere had little to do with my original question (i refere you to the top of the page), the original question hasn't been asked before, therefore i am not raising 'so many' threads about the same thing.

Let me re phrase the question for you and try to clarify:

i want to draw a graph on paper that represents the frequency response of a bandpass filter, i assume i can monitor the voltage at the output of the op amp used and plot it as i raise the frequencyto get my curve, is this right?

Neil.
 
A Butterworth filter is easy to graph without measuring it because its skirts drop at 6dB per octave for each order.
A multiple feedback bandpass filter is difficult to calculate a response curve on a graph because its skirts are steep near the peak then slowly reduce to 6dB per octave far from the peak.

Feed the filter a sinewave, vary the frequency and plot the output amplitude on a graph. Some filters are accurate only when driven from the extremely low output impedance of an opamp.
 
thanks Audioguru, on a slightly deviated point, i am constantly at wonder at how little a signal input needs to be to get large outputs, after two projects i built had massive overloads and clipping issues, todays op amps and semiconductors just have masses of gain.

thanks again

Neil.
 
Most opamps have an open-loop voltage gain (without negative feedback) of 200,000 from DC to about 20Hz. Then a capacitor inside the IC reduces its gain at 6dB per octave for higher frequencies so that it has no gain at high frequencies where its high frequency phase shift causes the negative feedback to be positive feedback which would cause severe oscillation.

When negative feedback is added it reduces the gain, reduces the distortion and reduces the output impedance.
This TL071 audio opamp has a flat frequency response to about 3200Hz when its voltage gain is 1000 and a flat frequency response to about 32kHz when its voltage gain is 100.
Two external resistors determine the voltage gain.
 
Hi Neil,

Start with a small input voltage level and sweep over the frequency of interest, find the frequency which causes the maximum output. If it clips, lower the input. If it doesnt clip, raise the input until it does clip. Now you know the input that causes clipping, and the input frequency that causes a max output.
You want to keep the input below that which causes clipping in the actual application.

The graph is made by running the frequency along the x axis (horizontal axis) and the amplitude along the y axis (vertical). That will give you an output vs frequency plot.
If you want to use semi log paper you can run frequency along the log axis, and have a linear amplitude plot.
If you want to use log log paper, you'll have both running along log axises.

In practice it is typical to see log frequency and linear amplitude, or both log. It's also typical to plot the amplitude in either regular units (like volts) or in db. To get volts db from the output voltage use the formula:
V(db)=20*log10(V(volts))
where log10 is the log base 10 log.

So you apply one frequency input at a given voltage determined above, then measure the output, then plot it on the paper or else convert to db and then plot that.
Note that you need to make sure the input voltage stays at the same level for the whole plot, even though you change the frequency. This means monitoring the input level as well as the output.

Now monitoring the input and output isnt quite as simple as all that. You need to use a volt meter that is capable of measuring frequencies in the range of interest. Most low cost multimeters on the AC scale are made to measure power line frequencies, like 50Hz maybe up to 400Hz. That's not adequate for measuring frequencies in the full audio range. You'll need to find a meter that can measure AC voltages at frequencies up to maybe 15kHz or higher, preferably 20kHz or 25kHz for audio work. If you cant find one or dont want to buy one, then you might be better off using a passive half wave rectifier circuit using a Schottky diode (not a regular rectifier diode). Unfortunately, this isnt perfectly simple either because you really have to calibrate the rectifier. Perhaps an op amp based rectifier circuit, but it has to use an op amp that can work up to maybe 10MHz or something like that, although this is really a different subject area that would be best with its own topic thread.

Small note:
Log paper is sometimes used because it allows plotting the frequency along the horizontal, and often in filters we dont see much change over a wide range of frequencies so we like to squeeze the horizontal axis. Log paper allows this and gives a little nicer picture of the response. If you dont have paper with the log scale running on the horizontal though, you can make your own roughly. If you mark off several points along the horizontal axis with equal spacing (as you would with any type of plot anyway) and then instead of marking them 1, 2, 3, etc., you mark those points 1, 10, 100, 1000, 10000, 100000. You then measure the response and plot using that kind of scale instead of a linear one. If that's not enough resolution, another trick is to use 1, 2, 4, 8, 16, 32, 64, 128, etc., where you just double the frequency to get the next mark point. Of course you can probably get a pic of log paper on line and use that as a guide too.
To get closer to actual real log paper, you can use the formula:
x=log10(y)
where
log10 is the base 10 log function,
y is the desired log mark point,
x is the actual position along the axis in linear units.
For example, to plot the log scale using this method you would first mark off equal distant points along the x axis as before, but then to mark sub divisions you would use that formula:
to mark the position for 2 you would use:
x=log10(2)=0.301 approximately,
so you would mark a point that is 0.3 times the total distance between the 1 and the 10 on the scale you already have marked. Just to give you an idea where this is, it's about 1/3 of the way from the 1 to the 10 (a little less of course).
Similarly, to mark the position for 3 you would use:
x=log10(3)=0.477 approximately,
so you would make a point that is 0.477 of the distance from the 1 to the 10 (this is close to half way between the 1 and the 10).
Not too difficult i suppose :)


Just a few ideas.
 
Last edited:
There is a paperback book ... Active Filter Cookbook by Don Lancaster ... printed at least until 1989.
It seems to have some material that is related to your inquiry ... active filter voltage gain formulas suitable for evaluation and graphing ... including derivations.
This book contains a number of heuristic rules for active and passive filter construction ... which might be worth examining.
 
Status
Not open for further replies.

Latest threads

New Articles From Microcontroller Tips

Back
Top