Continue to Site

Welcome to our site!

Electro Tech is an online community (with over 170,000 members) who enjoy talking about and building electronic circuits, projects and gadgets. To participate you need to register. Registration is free. Click here to register now.

  • Welcome to our site! Electro Tech is an online community (with over 170,000 members) who enjoy talking about and building electronic circuits, projects and gadgets. To participate you need to register. Registration is free. Click here to register now.

oscillator

Status
Not open for further replies.
...Mike would you mind posting the sim please? ...

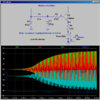
Here it is again: Same netlist as before, but a different circuit topology. Note the start-up transient. I'm posting both the image and the asc.

Osc1m1.jpg

Every Hartley I have ever seen has always utilized Mutual Coupling between the two inductors; so I stick to my opinion that this is NOT a Hartley.
 

Attachments

  • Osc1m.asc
    1.6 KB · Views: 187
Thanks for that mike, is useful to see how the sim is done.
 
Hi Mike,
Actually how we decide start time and stop time like 2m, 10m, 100n, 4050p etc as fast as possible? We need to choose super fast (smaller) time gap in UHF sim like few 'p', but we need slower time gap for AC mains sim or audio or VLF sim like 10m, 5m etc. If I didn't set correct time then I won't see clear waveform to find tiny distortion. Because wrong time produces a kind of wave form which has been extremely high 'zoom in' or extremely 'zoom out'. I need an idea to guess correct time value as fast as possible.
 
It is based on experience and repeated trials.

Since it is an oscillator, it will take time to start up. I first tried a sim run of 50ms, only to find that it started in about 500us. In the sim I posted first, I suppressed the start up transient, waited until its amplitude had stabilized by 0.995ms, and then I plotted from 0.995ms to 1ms to see about three cycles.

Here we have an oscillator that runs at ~50kHz, which is a period of 20us, so to see a few cycles, you would need to simulate for ~50us to 100us.
 
an oscillator that runs at ~50kHz, which is a period of 20us
Sorry I am little confused on your term, what did you mean? (should I have to see just 20uS to see its few cycles?)

Here we have an oscillator that runs at ~50kHz, which is a period of 20us, so to see a few cycles, you would need to simulate for ~50us to 100us.

Wow I really like simulation software! I used LTspice lot but never tried deeply. Just now I need to learn a feature quickly, that feature you used on 2nd post here. There is a 'small windows' which has various information about output waveform and output frequency of that oscillator. Once I tried to find output frequency on FM tx simulation but I had no idea.

How you did it Or where you clicked to get this window? ( sorry for simple question :) )
 
Last edited:
Sorry I am little confused on your term, what did you mean? (should I have to see just 20uS to see its few cycles?)
If the frequency of a period waveform is f, the period is 1/f. 1/50kHz = 20us. Too see 5 (several) cycles, simulate for 5*20us = 100us.

Wow I really like simulation software! I used LTspice lot but never tried deeply. Just now I need to learn a feature quickly, that feature you used on 2nd post here. There is a 'small windows' which has various information about output waveform and output frequency of that oscillator. Once I tried to find output frequency on FM tx simulation but I had no idea.

How you did it Or where you clicked to get this window? ( sorry for simple question :) )
1. Move the Mouse Cursor to the plot trace name at the top of the plot window.
2. Click Left Mouse button. A dashed line cursor will appear on the plot.
3. Move the Mouse Cursor over the vertical dashed line, a "1" will appear on the line.
4. Push Left Mouse button and drag the line to the start time of the measurement. Release button. The readout box appears.
5. Move the Mouse Cursor back to the plot trace name at the top of the plot window.
6. Click Left Mouse button. A second dashed line cursor will appear on the plot.
7. Move the Mouse Cursor over the new vertical dashed line, a "2" will appear on the line.
8. Push Left Mouse button and drag the line 2 to the end time of the measurement. Release button.

The readout box shows the delta time and voltage between the two cursors crosses.

Example here:

DF50a.jpg
 
I did same as you said. It is VERY simple hehe But again I am confused! I thought it shows total frequency of an oscillator but I got different output while I moved two cursors near and far. I did with an FM oscillator (approx 100MHz) but if I moved two vertical lines very near, it shows few GHz, and if moved far, it shows less than 50MHz. How can I understand it?
 
I did same as you said. It is VERY simple hehe But again I am confused! I thought it shows total frequency of an oscillator but I got different output while I moved two cursors near and far. I did with an FM oscillator (approx 100MHz) but if I moved two vertical lines very near, it shows few GHz, and if moved far, it shows less than 50MHz. How can I understand it?
If you are trying to determine the frequency, you have to move the two cursors so that they are aligned with two peaks on the waveform that are exactly one cycle apart.
Then the period (delta t) and frequency [1/(delta t)] are meaningful.
 
Hi,

Taking a quick look, this looks like it is working on the phase shift of the two L's and one C which form a pi network. That networks shows a phase swing from -pi to +pi around 50kHz and a gain of around 1. So it's sort of like a phase shift oscillator but using two L's and one C instead of a multiple RC network. There is probably some advantage but if this circuit has been classified before we'd have to find that to know for sure. It might be classified as a shunt fed Hartley oscillator as the topology is very similar.
 
Status
Not open for further replies.

Latest threads

New Articles From Microcontroller Tips

Back
Top