The Electrician
Active Member
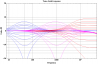
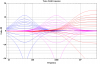
The following data is organized with all the resistor values first, then a table that shows the frequency response for two different frequencies 45Hz and 10kHz, which are most interesting, and that data is shown for three different settings of both pots as indicated, where each pot (one side) is set to either 0k, 10k, or 20k, as shown. The gain is then shown in db to the far right.
In the first post, the OP said:
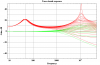
"This circuit is designed to cut the bass, mid and treble -26db and to boost them 6db. It works fine "
Your numerical results seem to show the opposite--boost of 20+ db and cut of 8 or so db. Have I misinterpreted your results?
")
